


Toronto Assesses Climate Risks and Learns About Vulnerabilities

Toronto’s first citywide climate risk assessment reveals which areas are most vulnerable.
30 March 2026
Combining spatial analysis, systems modelling, and community input, SSG worked with the City of Toronto to understand where climate hazards will hit hardest and how the City can be more resilient.
In July 2024, nearly 100 mm of rain fell on parts of Toronto in just a few hours. Subway stations flooded. Emergency services fielded thousands of calls. Insurance companies tallied more than $940 million in damages across Toronto and southern Ontario.
That same year, global average temperatures exceeded 1.5°C above pre-industrial levels for the very first time. Toronto has already warmed by nearly 1.5°C since 1950, and extreme heat, heavy rainfall, and wildfire smoke, once rare, are now regular features of the city’s summers. The 2024 flood was not a fluke, it is part of a new pattern of increasing frequency of extreme weather events. Understanding the risks and impacts of a changing climate will help the City prepare for an unpredictable future.
Over the past year, SSG worked with the City of Toronto on its first comprehensive Climate Change Risk and Vulnerability Assessment (CCRVA). The assessment analyzed more than 400 climate-related impacts, mapping where risks concentrate and how the consequences ripple across the city. The resulting report, presented to Toronto City Council in December, gives the City a shared foundation for acting to minimize the negative impacts of climate change.
How likely is this to occur?
How severe could the consequences be?
How vulnerable is the affected population or system?
More than 400 risks assessed across four urban systems
SSG assessed 11 climate hazards – from extreme heat and heavy rainfall to wildfire smoke and ecosystem change — against four interconnected urban systems: Toronto’s people and local economy, its infrastructure, municipal services, and natural environment.
To assess the risk extent for each hazard, SSG worked with the City to develop 400 potential climate impacts that each describe how a climate hazard affects a particular system or population. These included statements such as “heat-related illness for vulnerable residents” or “damage to road infrastructure from extreme precipitation.”
Each impact statement was then scored against three questions: how likely is this to occur, how severe would the consequences be, and how vulnerable is the affected population or system?
The answers aren’t the same for everyone. Elderly residents face greater health risks during poor air quality events. Low-income households are more likely to live in older buildings without air conditioning. These differences were built into the scoring, identifying which risks need to be prioritized.
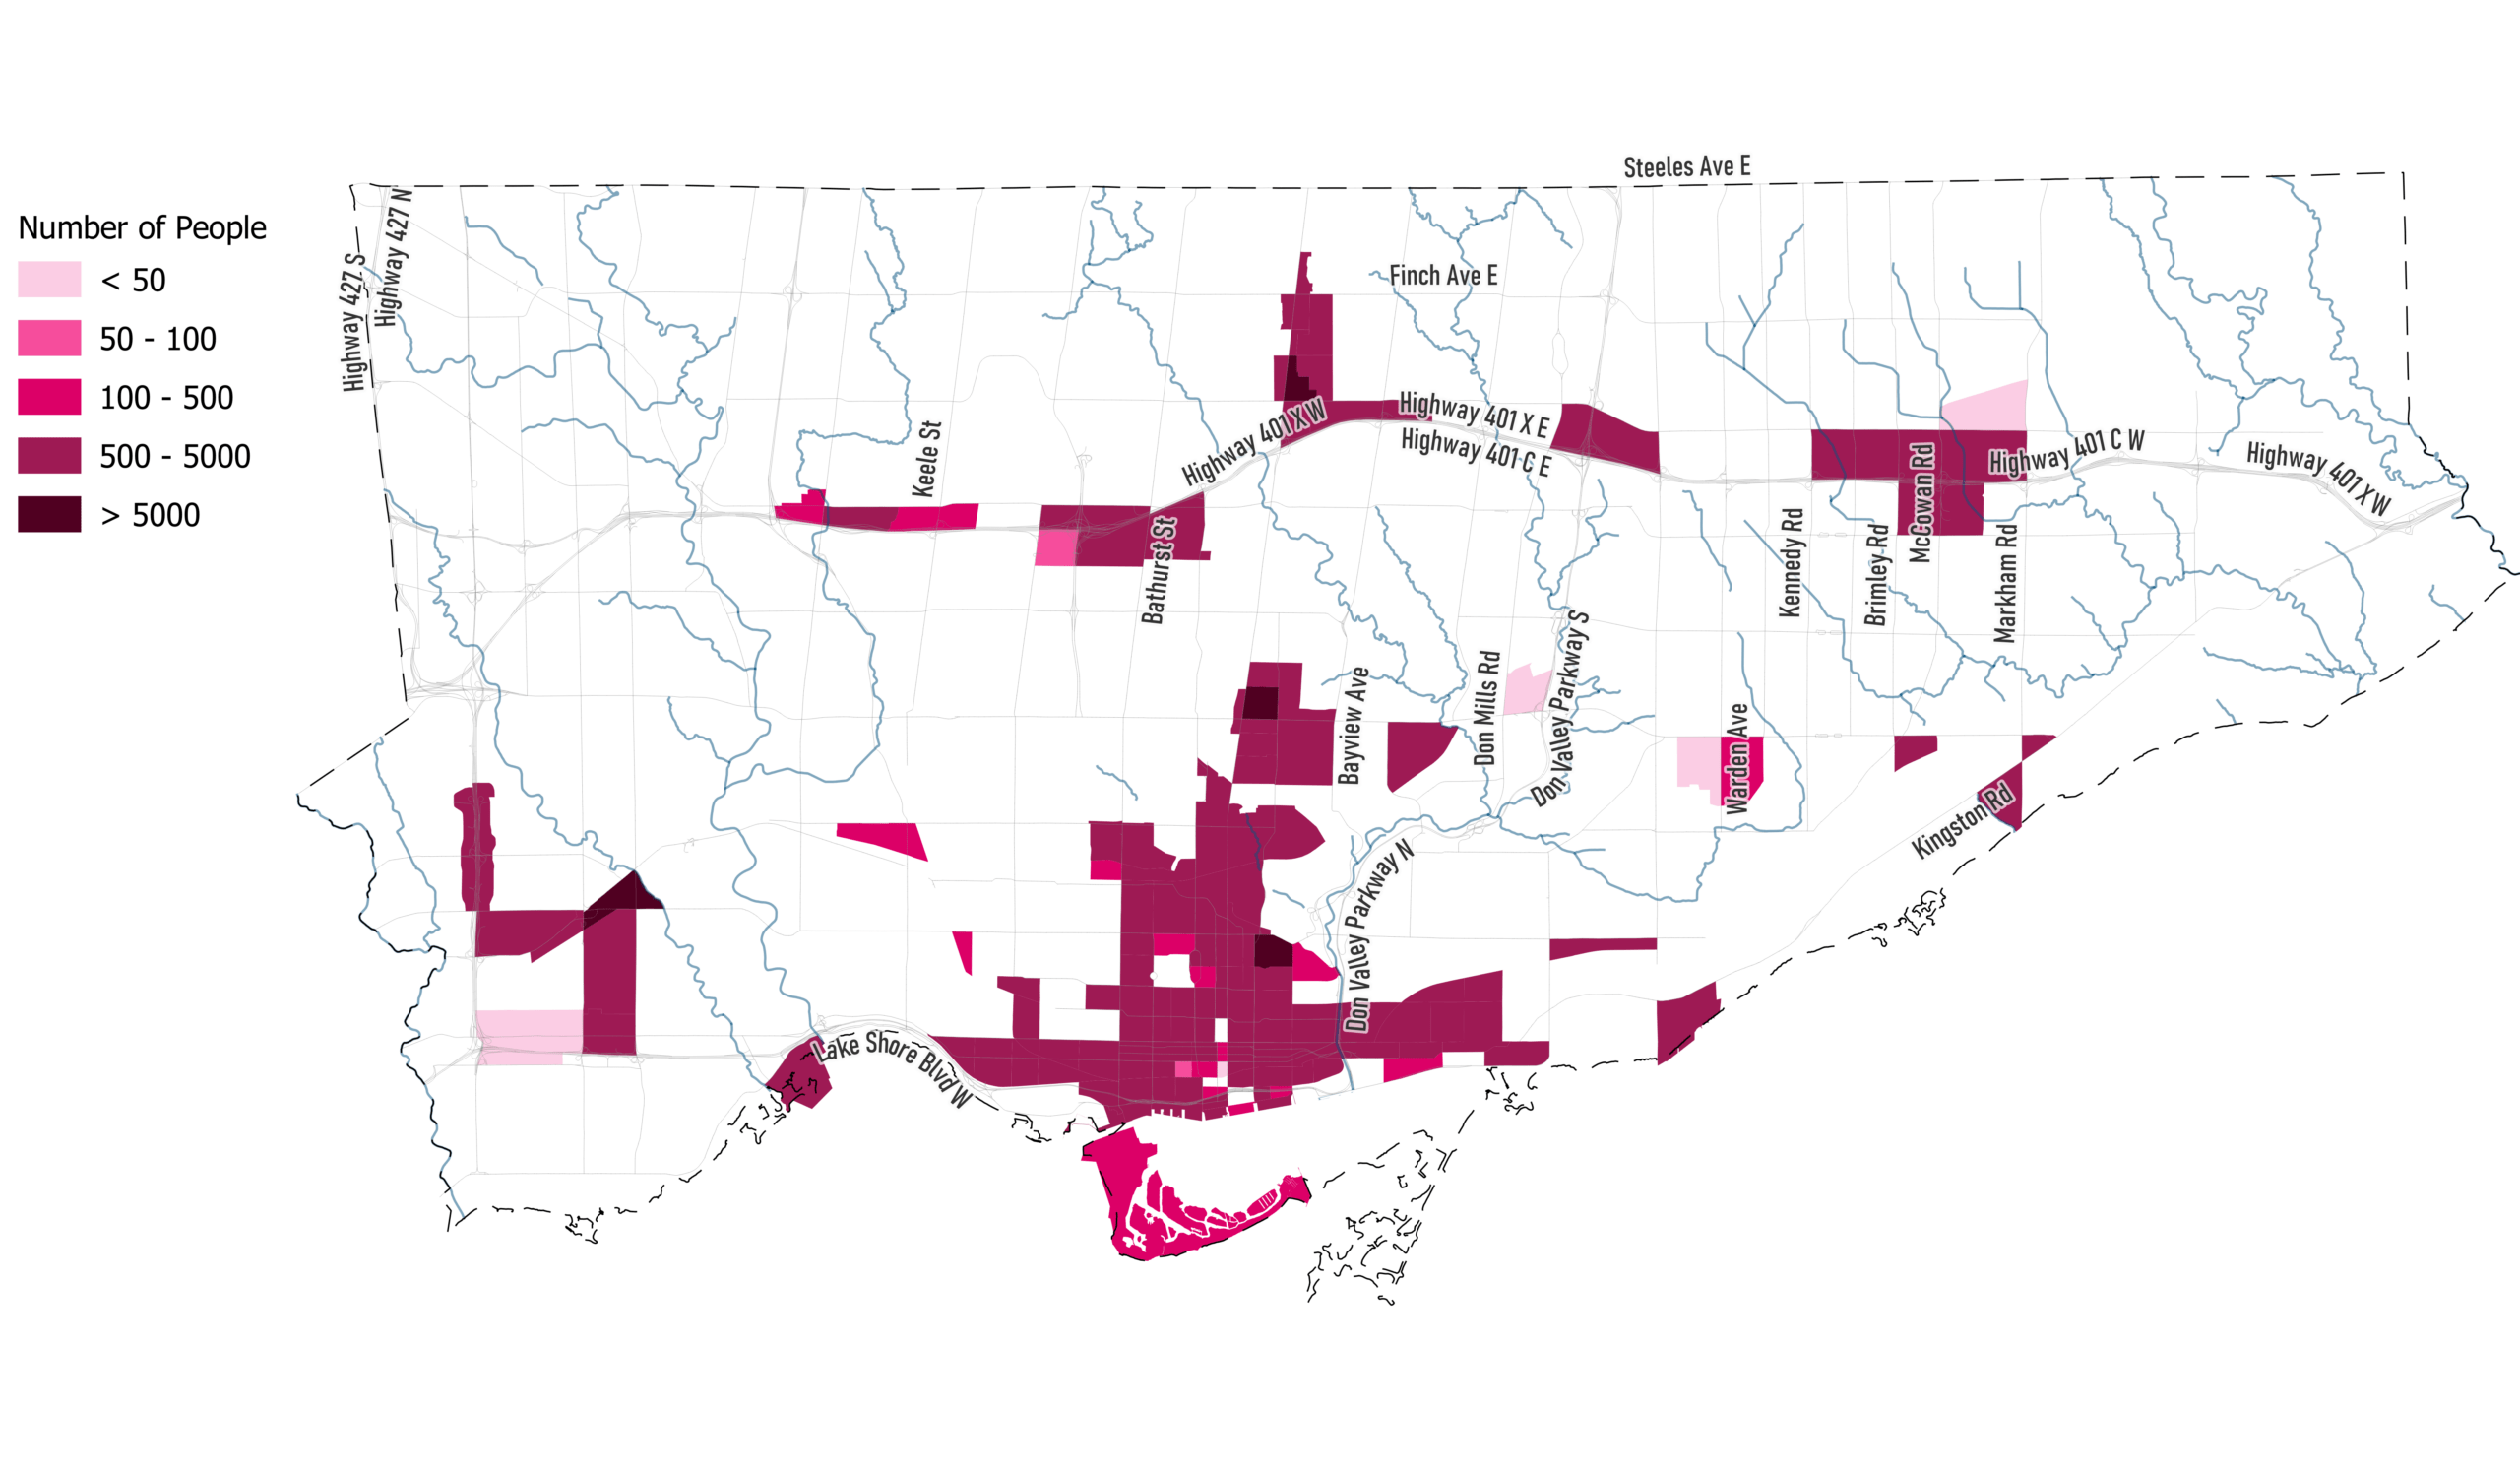
Where heat exposure meets vulnerability today. Within the areas of the City experiencing the hottest nighttime temperatures, colour intensity reflects the number of vulnerable residents: lighter areas have fewer residents at risk, while the darkest areas each have over 5,000 residents at risk.
Shaped by the people who know the city best
SSG worked with an Interdivisional Climate Resilience Team that included staff from more than 22 City divisions and five agencies who manage assets, deliver programs, and work directly with communities to plan for and respond to climate change. Their input shaped which risks the assessment prioritized, and what kinds of adaptation actions are realistic given the City’s operational realities.
Building on existing initiatives
Toronto is already taking steps to address the increased risks due to climate change. The assessment identified more than 80 existing actions already contributing to the city’s resilience such as heat relief programs, flood infrastructure investments, tree planting initiatives, and building retrofit programs. A key finding, however, is that many of these efforts are operating in silos. Stronger coordination across divisions and agencies can improve effective delivery of complementary actions. Building on this existing network of actions, the assessment identified more than 60 additional actions to help close gaps in current actions and increase coordination.
22
City divisions involved in Climate Resilience Team
80
identified actions the City of Toronto is already taking to address climate risks
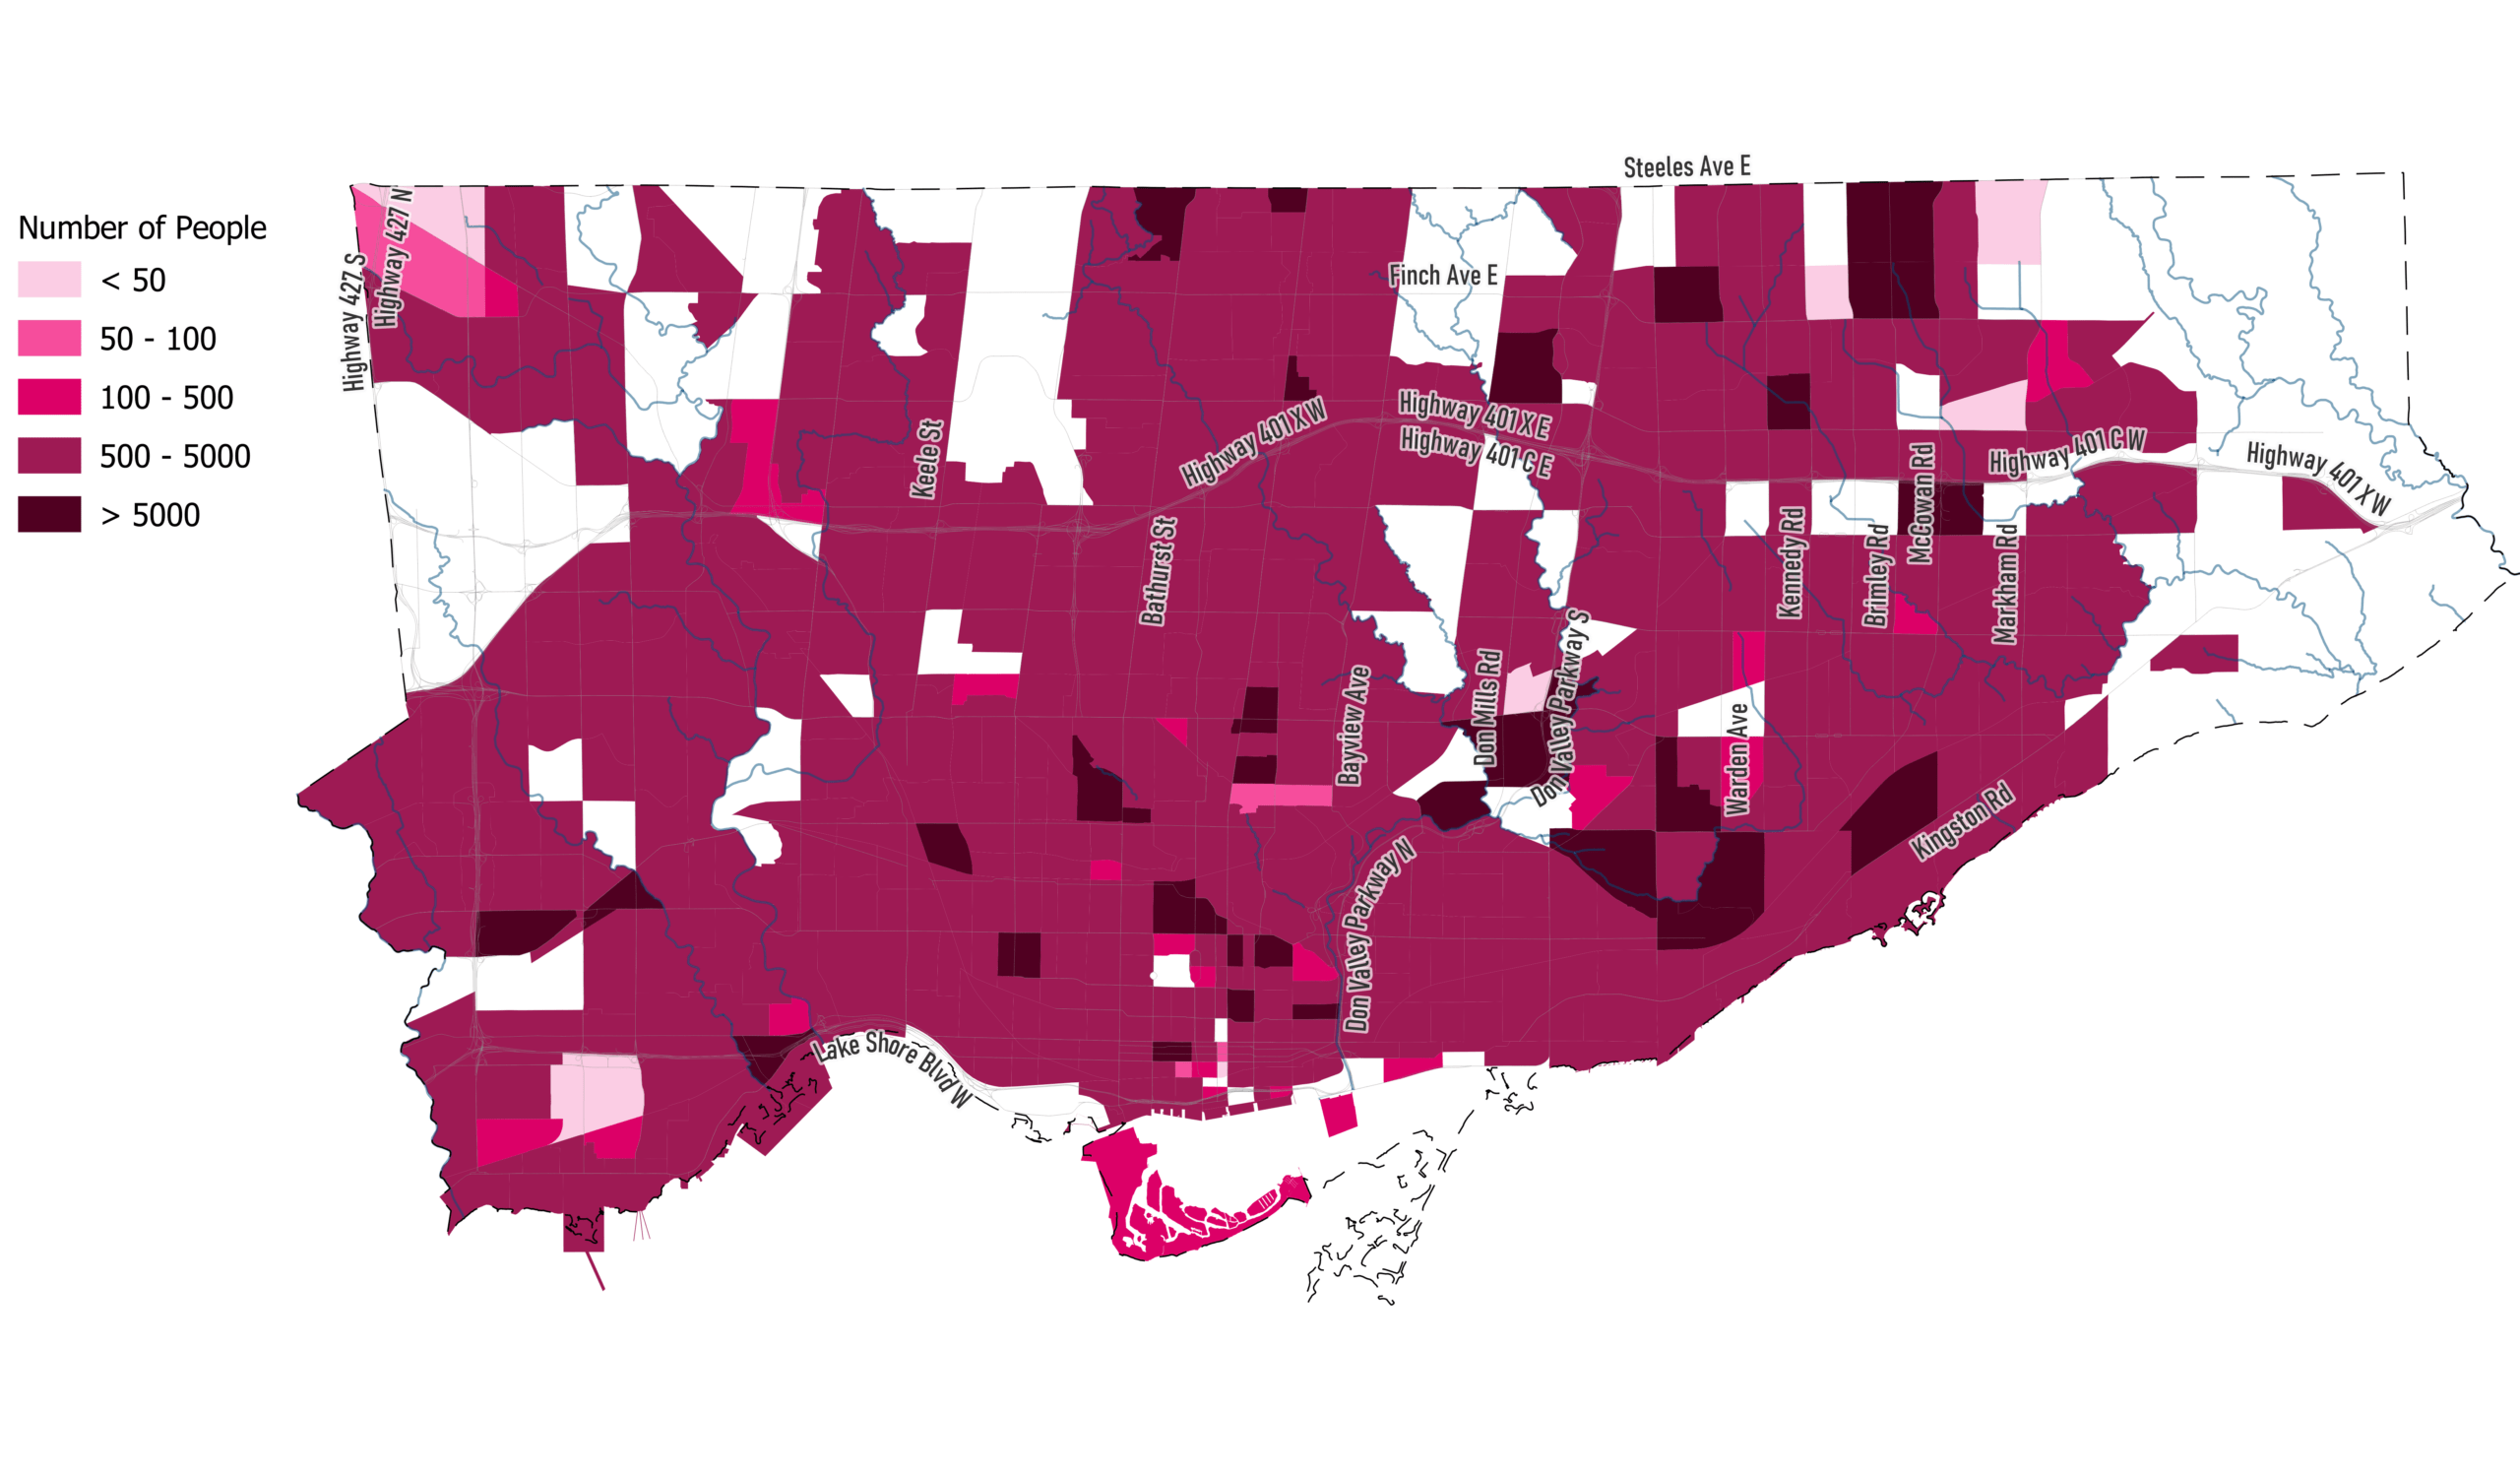
Where heat exposure meets vulnerability in the 2050s. Within the areas of Toronto projected to experience the hottest nighttime temperatures during a severe heat event, colour intensity reflects the number of vulnerable residents: lighter areas have fewer residents at risk, while the darkest areas each have over 5,000 residents at risk. This map is based on a medium emissions scenario.
Today, around 180,000 residents live in areas with a high-risk of overnight temperatures… by the 2050s that number could rise to 1.3 million.
Cascading risks: when systems fail together
Improving coordination is especially vital because climate hazards rarely affect just one system at a time. The assessment also examined how one event can trigger a chain of failures. A power outage during a heat wave doesn’t just mean lost electricity — it could close cooling centres, strain emergency services, and isolate residents who depend on elevators or medical equipment. SSG used a systems dynamics mapping framework to trace how these cascading impacts could amplify the number of people affected, and integrated that analysis directly into the risk assessment.
Seeing where risk concentrates
To understand how risks play out across the city, SSG used the ScenaAdaptation model to assess the potential impact of extreme weather events down to individual buildings. For example, for extreme heat, SSG modelled overnight temperature variations during heat events. Building type, age, tree cover, and access to air conditioning all shape who is most exposed. Today, around 180,000 vulnerable residents live in areas that have a high-risk of overnight temperatures during a major heat event, and that exposure is concentrated in specific areas of the city. By the 2050s, under a medium-emissions scenario, that number could rise to 1.3 million.
The modelling also revealed what mitigates this escalation. If Toronto could achieve 40 per cent tree canopy cover by 2050, SSG’s analysis suggests the City could cut exposure to high-risk temperatures by half: keeping heat risk at roughly today’s levels even as the climate warms.
Mitigation and adaptation go hand in hand
Preparing for climate risks and reducing the emissions that drive them aren’t separate agendas. Many of the actions that reduce emissions in Toronto also build resilience. For example, retrofitting older buildings improves energy efficiency and makes homes more resistant to extreme heat. Planting trees reduces carbon pollution while also cooling neighbourhoods and absorbing stormwater.
Toronto has already met its 2020 target of reducing emissions 30 per cent below 1990 levels and is working toward net-zero emissions community-wide through the TransformTO Net Zero Strategy. By pursuing mitigation and adaptation together, the City can address climate change on two fronts while delivering benefits that protect residents and strengthen systems at the same time.
Climate resilience isn’t just about surviving extreme weather. It’s about ensuring that a heat wave doesn’t trap seniors in sweltering apartments, that a heavy rainfall doesn’t strand commuters for hours, and that the people with the least resources aren’t left most exposed. This assessment is a step toward building a resilient city for all.
By pursuing mitigation and adaptation together, the City can address climate change while delivering benefits that protect residents.
Contact Us
We can help you address the climate crisis and navigate the energy transition